Ever wonder how your favorite bangers become visible sound? Imagine watching your beats as they morph and bounce on the screen – that’s a waveform for you! But what exactly is a waveform and how does it translate our dope audio into an understandable graphic? Let’s demystify this cornerstone of music production and audio engineering, shall we?
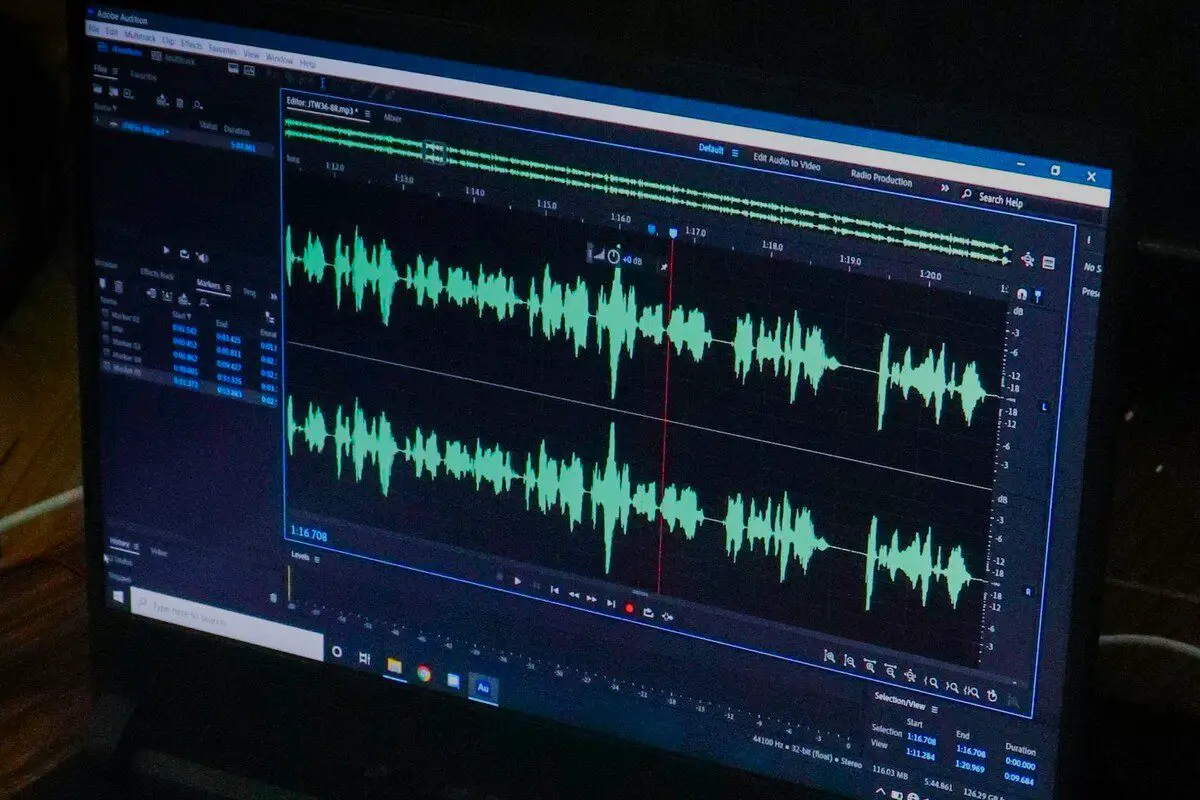
What is a waveform? A waveform is essentially a visual graph that displays changes in amplitude or level over time in digitized sound. It’s like a sonic fingerprint that lets audio engineers and music producers see the ‘shape’ of the sound they’re working with.
What are waveforms?
Waveforms are the lifeblood of audio engineering and music production. Without them, it’d be like trying to compose a symphony in a pitch-black room. By visualizing the amplitude or level changes over time in our digitized sound, we get a tangible representation of our intangible audio and they allow us to visually interpret the sound.

Waveforms aren’t just cool graphics on your DAW (Digital Audio Workstation). They’re the tools we use to sculpt the sound. Like a map for a sound designer, a waveform guides us through the terrain of a track, showing us where the peaks and valleys (the louds and softs) of our audio are.
AKAI Professional MPK Mini MK3

AKAI Professional MPK Mini MK3
How do we see sound?
Sound, as we know it, is a pressure wave traveling through the air. But in the realm of digital audio, we have to convert these analog signals into something a computer can understand. That’s where digitization and amplitude come into play.
When we digitize sound, we’re essentially sampling it at regular intervals and measuring its amplitude at each of these moments.
When we digitize sound, we’re essentially sampling it at regular intervals and measuring its amplitude at each of these moments. Each of these measurements (or samples) then gets converted into a binary number, which our computers can understand.
Amplitude, on the other hand, is all about the strength of the sound wave at a particular moment. In simple terms, it’s how ‘loud’ the wave is. So, when we’re looking at a waveform, the height of the wave represents its amplitude. Higher waves are louder, and shorter waves are quieter. Just think of amplitude as the difference between a whisper and a shout!
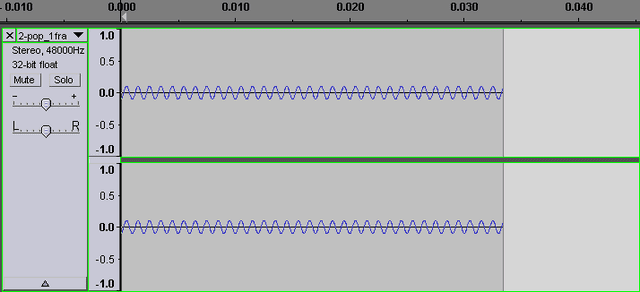
When you take a close look at a waveform, it reveals a whole universe of tiny, discrete changes. So, you’ve got your waveform in front of you, and at first glance, it looks pretty smooth, right? But let’s put on our audio microscope and zoom in. What you’ll start to see are tiny fluctuations — thousands of them!

Each one of these represents a single sample of our digitized sound. The waveform is really like a massive mountain range, filled with peaks and valleys, each telling its own little part of the sound story. It’s the sum of all these tiny parts that creates the sounds we love, from the bass drop in your favorite EDM track to the delicate strumming of a guitar in a folk song. Just like a pointillist painting, each tiny dot adds up to create a beautiful sonic picture.
Why does amplitude have positive and negative values?
Amplitude has positive and negative values, which might seem odd at first. I mean, can you have negative loudness? But it’s just the way we represent the pressure variations of a sound wave in the digital domain. A sound wave moves air molecules back and forth – when they’re pushed together, we represent that as a positive value, and when they’re pulled apart, it’s a negative value. No negative loudness, just an awesome dance of physics!
When we’re dealing with digital audio, we’re actually dealing with a two-dimensional representation of a three-dimensional phenomenon. What?! Here’s the key: a sound wave is all about movement—specifically, the movement of air particles. They’re squished together (compressions) and spread apart (rarefactions) as the sound wave travels.
When we see a waveform, the middle line (or zero line) represents no pressure difference—basically, silence. When the wave moves above the line, it’s showing compressions (positive values). Below the line, it’s rarefactions (negative values). There’s no dark side to sound, just a visual representation of how sound waves travel!
| Do’s | Don’ts |
|---|---|
| Do aim for consistency in the volume of your tracks to maintain balance in the mix. | Don’t crank up the amplitude so high that it causes distortion or clipping. |
| Do use tools like compressors and limiters to control the amplitude of a track. | Don’t ignore the dynamics of a track by making all sections the same volume. |
| Do understand that amplitude affects perceived loudness and can have an emotional impact. | Don’t make the amplitude so low that the track becomes inaudible or loses its impact. |
| Do use automation to adjust the amplitude of certain sections or elements within a track. | Don’t forget to consider the overall mix when adjusting the amplitude of individual tracks. |
How does level fit into the picture?
Now that we’ve got amplitude down pat, let’s look at its partner in crime: level. If the amplitude is our sonic volume knob, think of level as our reading on the volume meter. It’s another way of looking at the ‘loudness’ of a signal but with a few differences.
Here’s the thing about level: it’s a more general, averaged measure of amplitude. Instead of looking at each individual peak and trough, level gives us a broader view of the signal’s loudness. Level is like getting the gist of a conversation without noting every single word.
…level is less concerned about the detailed motion of the wave and more about its overall energy.
Level can also be seen as the absolute value of amplitude changes, disregarding whether it’s a positive or negative change. Essentially, level is less concerned about the detailed motion of the wave and more about its overall energy.
If you want even more great tips and information, check out the video below.
Frequently Asked Questions (FAQ)
There’s a lot to wrap your head around when it comes to waveforms and the various concepts we’ve discussed. To make things easier, let’s tackle some frequently asked questions.
What is the Nyquist Frequency and why is it important?
The Nyquist Frequency is half the sample rate of a digital audio system. It’s crucial because it represents the highest frequency that can be accurately sampled without causing aliasing (a form of distortion). So, in an audio system with a standard sample rate of 44,100 Hz, the Nyquist Frequency would be 22,050 Hz.
How does Pulse Code Modulation (PCM) work?
PCM is the standard method used to digitally represent analog signals, in this case, sound. In PCM, the amplitude of the analog signal is sampled regularly at uniform intervals, and each sample is quantized to the nearest value within a range of digital steps.
Can we hear all frequencies equally?
No, we can’t. Human hearing is typically sensitive to frequencies from 20 Hz to 20,000 Hz. However, our ears are not equally sensitive to all these frequencies. We’re most sensitive to frequencies between 2,000 and 5,000 Hz, which is the range of most human speech.
Conclusion
Alright, beat makers, audio nerds, and sound wizards! Did I cover everything you wanted to know about waveforms? Let me know in the comments section below. I read and reply to every comment. If you found this article helpful, share it with a friend, and check out my full blog for more tips and tricks on audio engineering. Thanks for reading, and keep those sound waves flowing!
Key Takeaways
This article covered the concept of waveforms in audio engineering and music production. Here are some key takeaways:
- A waveform is a visual representation of digitized sound, showing amplitude or level changes over time.
- Amplitude has positive and negative values, representing the compressions and rarefactions of sound waves, respectively.
- Level provides a more generalized view of a sound wave’s amplitude.
- Zooming into a waveform reveals tens of thousands of discrete changes, each representing a single sample of sound.
- Understanding the fundamentals of waveforms and their characteristics is essential in the field of audio engineering and music production.


